(c) Harald Schilly / 2001.05.19

prettier plotting in MMA!

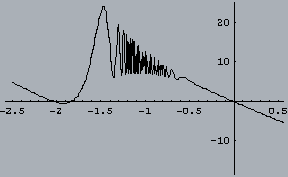
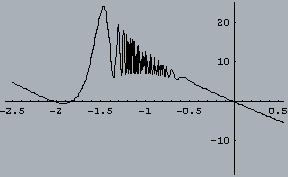
used function (partly normal, partly complicated, but very nice)

[Graphics:Images/index_gr_1.gif]

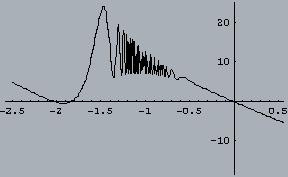
only standard, but look at the bottom. there is " - Graphics - " -> this could be suppressed using a ";" in the end of the inputline.

[Graphics:Images/index_gr_2.gif]

[Graphics:Images/index_gr_3.gif]

[Graphics:Images/index_gr_4.gif]

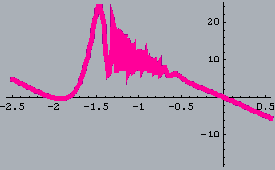
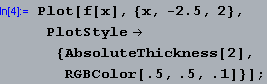
thickness and color added

[Graphics:Images/index_gr_5.gif]

[Graphics:Images/index_gr_6.gif]

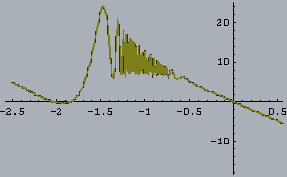
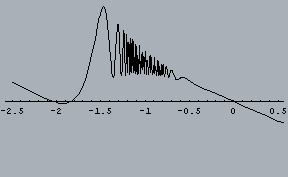
thickness in absolute (dot) size given and the color in RGB  (a 3rd useful alternative is GrayLevel[0..1])
[Graphics:Images/index_gr_7.gif]

[Graphics:Images/index_gr_8.gif]

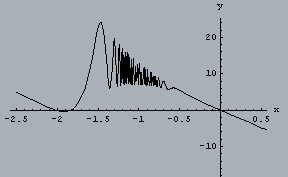
standard labels

[Graphics:Images/index_gr_9.gif]

[Graphics:Images/index_gr_10.gif]

only one axes

[Graphics:Images/index_gr_11.gif]

[Graphics:Images/index_gr_12.gif]

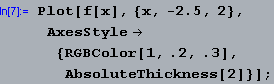
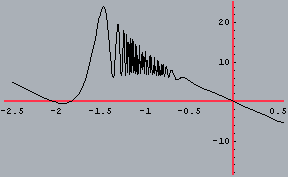
axes style added

[Graphics:Images/index_gr_13.gif]

[Graphics:Images/index_gr_14.gif]

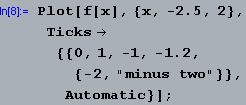
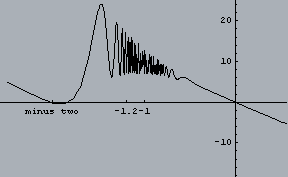
special tic-marks and labels

[Graphics:Images/index_gr_15.gif]

[Graphics:Images/index_gr_16.gif]

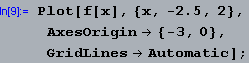
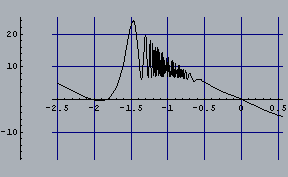
standard GridLines

[Graphics:Images/index_gr_17.gif]

[Graphics:Images/index_gr_18.gif]

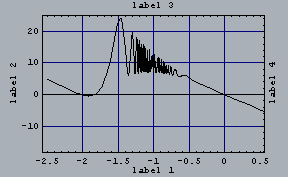
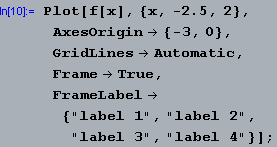
standard GridLines with a frame around the plot and labels on all 4 sides
[Graphics:Images/index_gr_19.gif]

[Graphics:Images/index_gr_20.gif]

only 2 vertical GridLines

[Graphics:Images/index_gr_21.gif]

[Graphics:Images/index_gr_22.gif]

specific PlotRange

[Graphics:Images/index_gr_23.gif]

[Graphics:Images/index_gr_24.gif]

different ratio between x and y axes

[Graphics:Images/index_gr_25.gif]

[Graphics:Images/index_gr_26.gif]

specific ImageSize (horizontal) - vertical size is calculated using AspectRatio

[Graphics:Images/index_gr_27.gif]

[Graphics:Images/index_gr_28.gif]

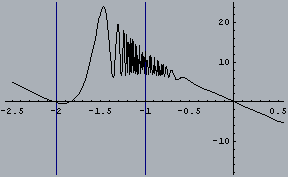
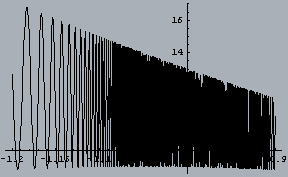
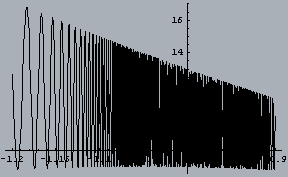
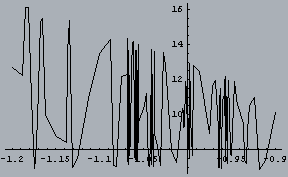
there are some fringes in the plot, because of too much different points in a small interval

[Graphics:Images/index_gr_29.gif]

[Graphics:Images/index_gr_30.gif]

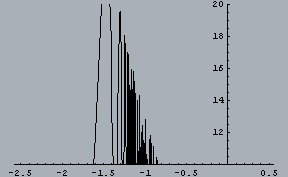
higher number of PlotPoints reduces the problem

[Graphics:Images/index_gr_31.gif]

[Graphics:Images/index_gr_32.gif]

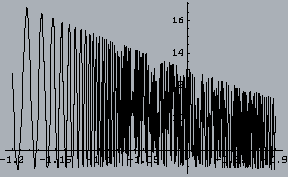
higher number of divisions reduces, too

[Graphics:Images/index_gr_33.gif]

[Graphics:Images/index_gr_34.gif]

this special feature sets the maximum bend angle between successive line segments on a curve. (at 90 it lookes really awful)

[Graphics:Images/index_gr_35.gif]

[Graphics:Images/index_gr_36.gif]

suppress output when storing a graphic into a variable is very usefull

[Graphics:Images/index_gr_37.gif]

in opposite to this, where the plot is still drawn

[Graphics:Images/index_gr_38.gif]

[Graphics:Images/index_gr_39.gif]

later you can call p1 using Show[p1], but the DisplayFunction must be modified

[Graphics:Images/index_gr_40.gif]

[Graphics:Images/index_gr_41.gif]